THE 4 DIMENSIONS
MPI BRILLIANTLY COMBINES THE 4 DYNAMIC DIMENSIONS
Resources, projects, time are governed and synchronized in every imaginable way. You might coordinate them as shown below with the double Gantts, the Visual Planning Work Bench.
Resources are the bottleneck constraints and drivers and an integrated dimension in everything. Resources can be people, suppliers, equipment etc.
When you have assigned resources and the estimated work required by hours, units, money, you have the foundation for all calculations and diagrams.

Syncronized Gantt charts MPI’s unique planning tool: Governance and overview of Projects, Resources, Time. Attach resources to projects. View capacity, roles, dependencies, deadlines, milestones and the economy of the projects. Explore different scenarios. Avoid potential bottlenecks. Optimize your project stream.
Perspectives. Configurable for all users
Configure layout of any user dialogue and save it in your menu tree or tiles. Views (grids, table views, graphical interactive charts, Gantt, reports, dash boards etc.) are combined and placed on the screen (“dock”) and the layout is customized with column chooser, position, naming, command lines etc. And you can choose to save any parameter e.g. filters, groupings, calculations, choice of accounts, time resolution, etc.
Perspectives support roles throughout the organization, whether you’re an individual, project manager, resource manager, or top/financial management. Views are combined and placed on the screen (“dock”) and configured with columns, data filters, sorting, calculations etc. The perspective is stored in a personal or common menu. Access rights can be defined by administrator.
Also command lines can be customized in the perspective. From ultra simple to advanced.
Next time a click on the perspective in the menu and you will see exactly what you defined.
Flexible time line
MPI integrates portfolio, project and resource management in one solution. Strategic planning, portfolio, based on forecasts and pipeline for Projects as well as execution and analysis..
This is possible because of the unique MPI option to change time resolution with a click for any assignment. MPI handles combinations of time resolutions in one environment. You simply increase resolution as needed when an activity comes closer to execution and more detailed control might be needed.
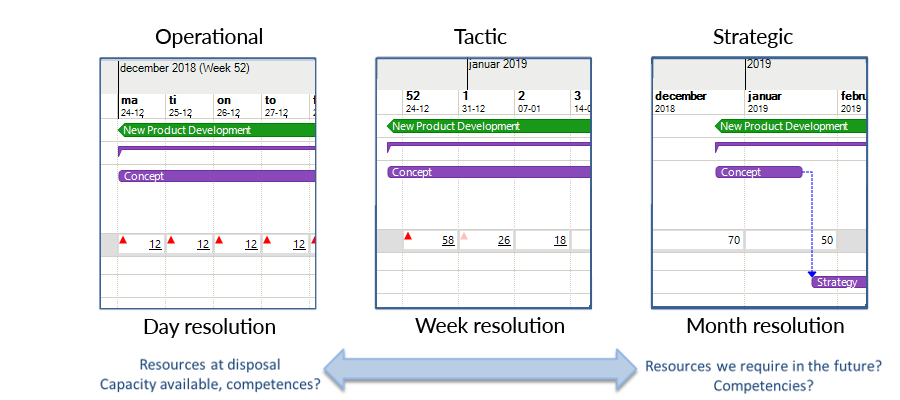
This flexibility also means that all calculations of load, budgets etc. automatically are correct when you zoom in on weeks and days from months.
Templates. Projects made easy
Projects can be easily defined using templates like building blocks. Templates can reflect your project standard model and can contain milestones, stages and formal feedback and status including risk management.
In MPI the standard templates assure standardization and quality of processes.
Simple Assignments of Resources. Double Gantt
MPI is the unique tool with a full generic resource dimension. Essential for realistic planning & execution.
The Resource Gantt synchronized with Project Gantt offers the unique planning workbench incorporating the 3 dimensions of jobs, resource, time and consequences in one function.
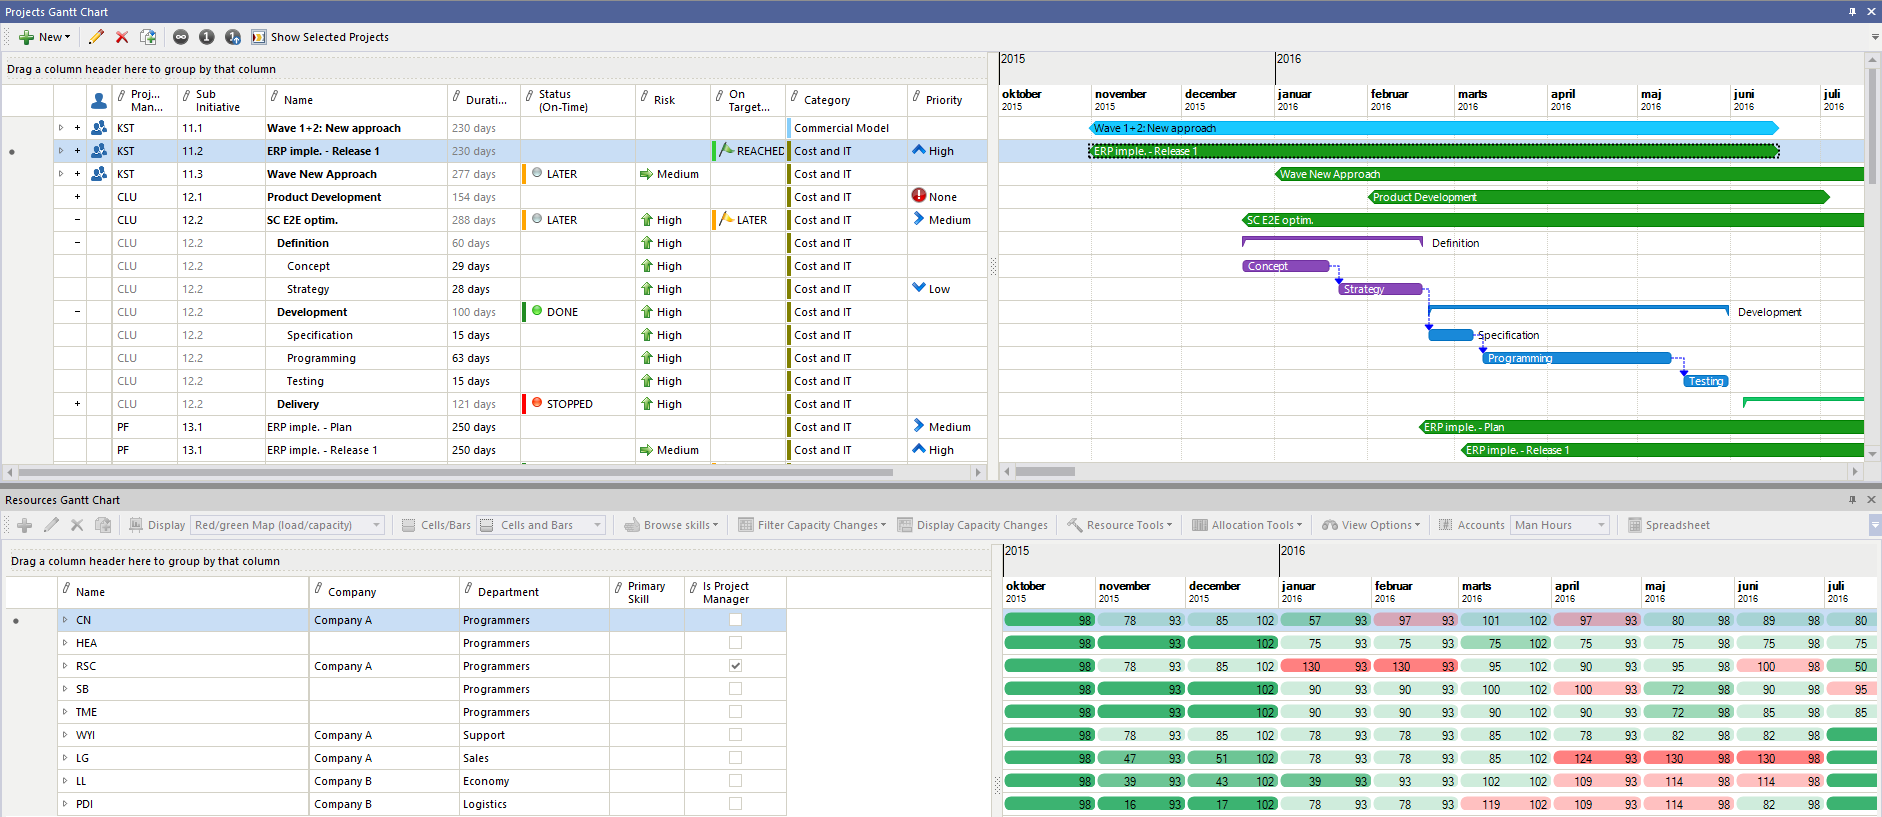
It is easy and visual to define and view assignment load, cost and other data by period in Gantt charts. You simply open “Time Cells” directly under each activity block. You decide the periodization, day, week or month, see point 3 above.
The Resource Gantt will show you load, capacity, delivery, economy etc. for any type of resource, people, equipment, materials, Money. It will color bottlenecks, and other values by period.
Standardize the way you Work. Templates for projects and parts of projects makes it easy to create new projects and consistent access to resources from either an overview or detailed perspective with the ability to shift between days, weeks, or months gives you the flexibility you need.
‘RAF’ – Resource Assignments First
RAF is MPI’s innovative new concept and technology for PPRM, which simplifies project control immensely compared to traditional complex WBS based project management. It is an upside down approach where projects are defined by their resource assignment on the project line directly. Allocation of resource roles (skills and departments) define projects. The method is particularly efficient when you deal with streams of professional projects fulfilling the same purposes. This could be outsourced product development.
Some of our customers work in 2 steps:
First Project Owners size the project assigning work roles, e.g. programmers, solution architects, mechanical engineers and usability experts. Done with full information about each work roles aggregated available capacity. This ensures realistic timing and delivery commitments. You simply use the ‘green man’ icon in MPI.
Secondly Line Managers fill in individuals or teams to meet the roles based budgets according to skills and capacity available. Graphical Gantt displays are updated real time. They guide the process by showing capacity versus load and how much of the budget from first level is fulfilled.
RAF comes with smart supporting tools and overview displays like Gantts and Dashboards showing the overall status, e.g. people assignments (planned work) vs budget.
Visual Control of Deliverables. Prince 2
Prince2 and PMI recommends that you focus your project mangement on “products” and deliverables.
MPI is the first application which fully integrates product design with traditional project management.
Graphical definition of Product Break Down (deliverables), and Product Flow (dependencies) (PRINCE2). MPI generates automatically the Project Break Down and Project Gantt. The project plan links backwards to Product Break Down.
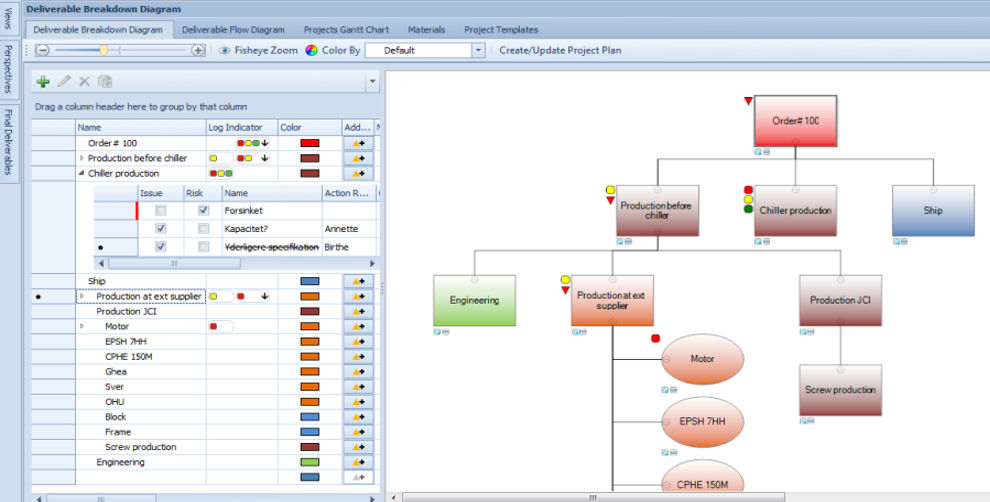
Issues, warnings, risk and RAG signals are shown as traffic lights in the deliverable chart. This gives a clear overview of the situation for steering comittee meetings and timely action can be taken on the spot with responsible and deadline.
We call it Visual Portfolio Leadership.
Forecasting and Budgeting
Resources drive budgets. When you know how many hours are required month by month in your forecast, MPI calculates on the fly the resulting cost and revenue. This is done by reference to price tables.
This is very important because you are forced to be realistic and structure everything based upon what is needed in terms of resources. It makes follow up transparent and makes it easy to make scenarios, e.g. see the effect of using off shore services instead of own resources.
The consequences of the forecasts are reflected directly and real time updated in the monthly project report.
THE SIMPLE BUDGET PROCESS:
Project Managers. E.g. Monthly input. Fixed routine
Financial Department. Management
Financial Department. Management:
Project Managers. E.g. Monthly input. Fixed routine:
Scenarios and Consequences
Handle the unexpected. When the unforeseen happens, like more effort needed, illness, external demands and, delays in deliveries, you must make difficult decisions about priority, move milestones, reassigment of resources, change of scope etc.
Many decisions are complex because of so many dependencies, between tasks, projects and resource availability.
A good way is to prepare scenarios and compare them on a set of parameters.
MPI has uniquely powerful and easy controllable scenario capabilities. It is also a great vehicle for calculations, horizontally over the time line for any value type combined with vertical summations up through Work Break Down structures and groupings in grids.
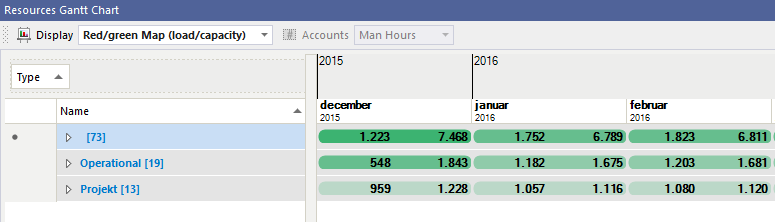
Lines in grids and tables can be grouped on any value and parameter you want, e.g. business unit, department. organizational roles, status, priority etc. Grouping can be nested by level. just by dragging column headers.You can click on a group line and fold out to see the underlying details by any period. The smart thing is that every calculation automatically sums up on grouping level.
Example of Grouping on Resources. Grouping by Department.
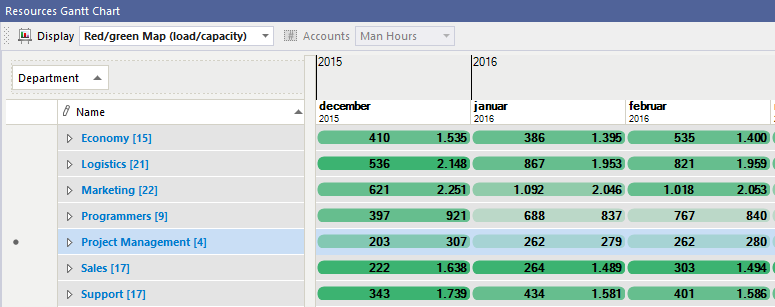
Grouping by Type. Values are automatically re-calculated.
The account dimension offers you free definition of values you might want to operate with on the time line, associated to assignments. MPI comes with standard accounts for e.g. planned and reported hours, budgets for cost, revenue, and many more. You can define your own accounts and calculation rules, e.g. KPI’s and financials.
In this way you can set MPI up to do almost any imaginable consequence calculation.
Results can be put into Dash Boards, spread sheets or advanced diagrams. Accessible via web.
Dashboards. Flexible Management Reporting. BI
MPI has a rich and easy dash board functionality for management information.
You just click to set up links to MPI database as well as external databases. It is saved as a perspective
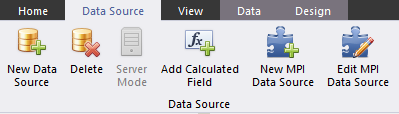
Setting up managing Data Sources
Examples of Dashboards
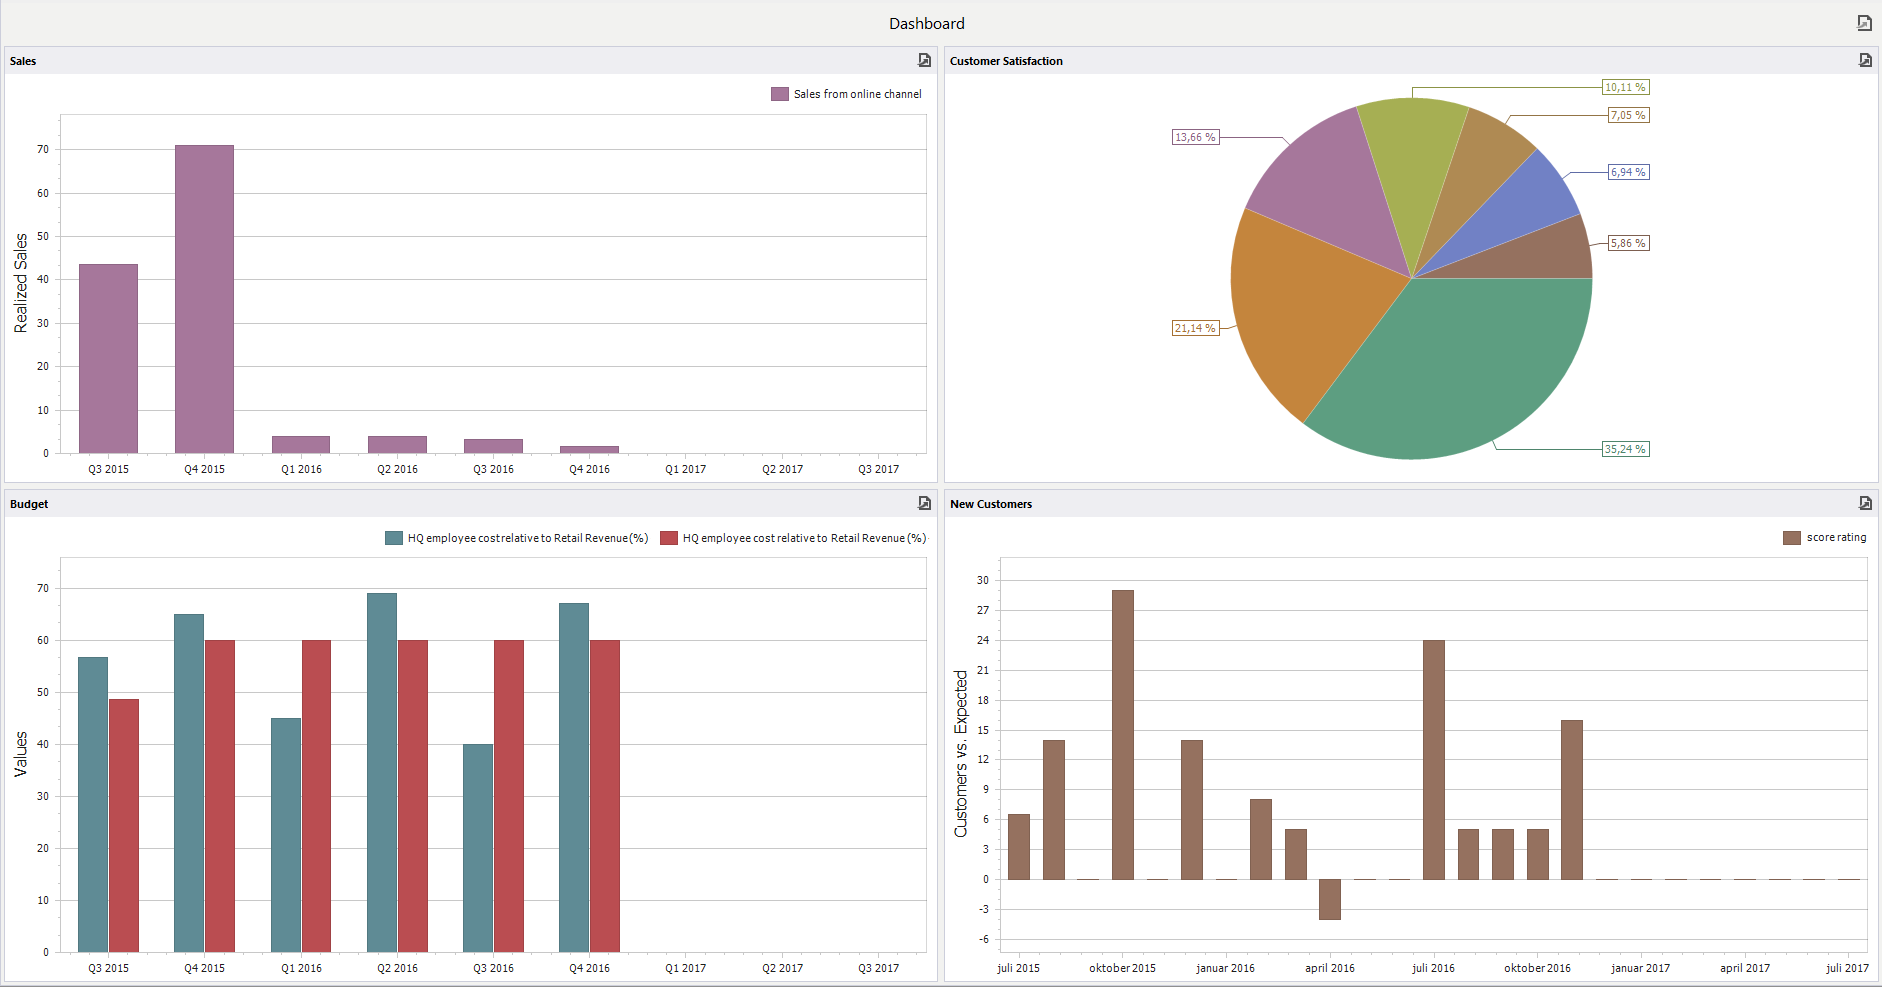
The online dash board updates itself automatically.
You are in personal control of your offline dash boards. You take snapshots with a click at any given moment. Data from snapshots are presented in trend lines for any performance parameter e.g. budget.
Boost Excel. Simple Data Connection
Spread sheets can be hell. Excessive maintenance, inconsistent, insecure and limited communication.
MPI’s offer the structure and secure accessability to the common database. It offers a calculation and planning engine which is always correct.
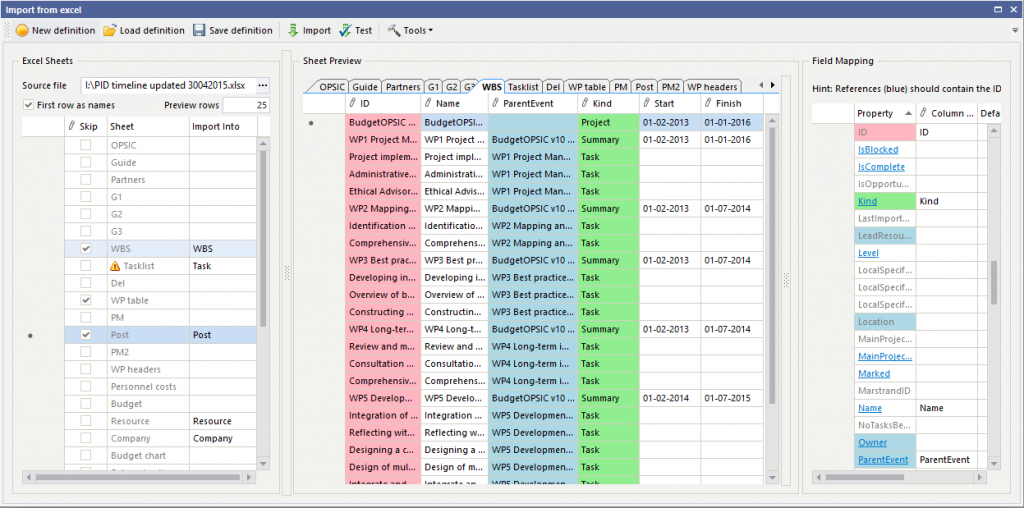
Input: MPI takes input from Excel in 3 ways :
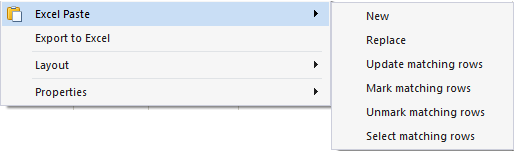
– Cut from existing Excel and paste directly into MPI. Database references are solved automatically.
– Take an Excel sheet and define data mapping from fields into MPI fields. Excel works as an external input medium with your own calculations.
– Define a control file to control data mapping for batch jobs.
Output: MPI comes with an advanced spread sheet designer. You can export any MPI spread sheet to Excel or on the web.
This Means easy implementation. because you can communicate precisely as your people are accustomed to.
MPI also offers other advanced means of data interfacing, e.g. with ERP systems.